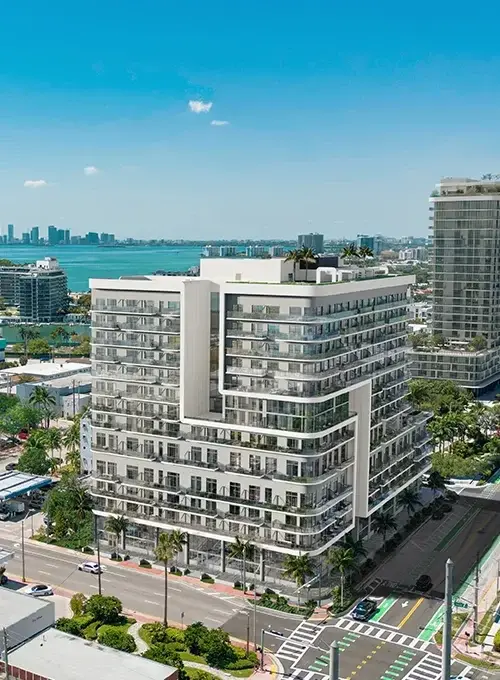
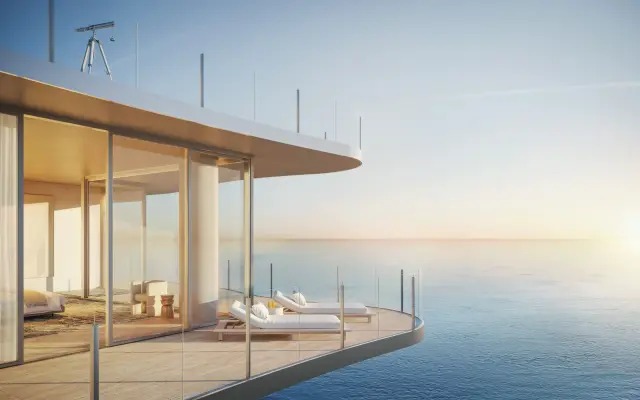
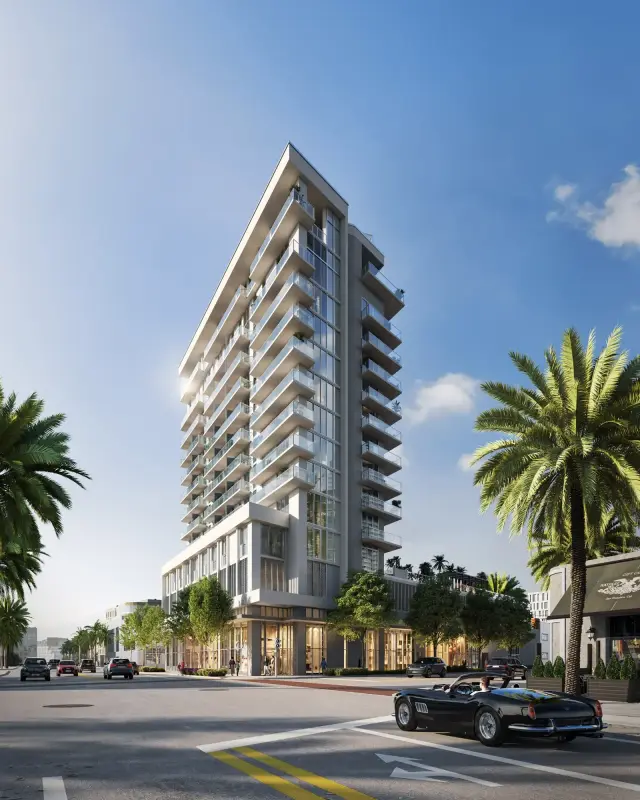
Miami Art Week 2026Upcoming
15 Art Week exhibitions within or near Mid-Beach & North Beach.
Ranks #5 of 12 in Miami
- 1.Edition Residences62 / 100
- 2.29 Indian Creek61 / 100
- 3.Clearview Towers60 / 100
Condos for sale, prices, sold data and building guides
Millionaire's Row and the beach beyond 63rd Street.
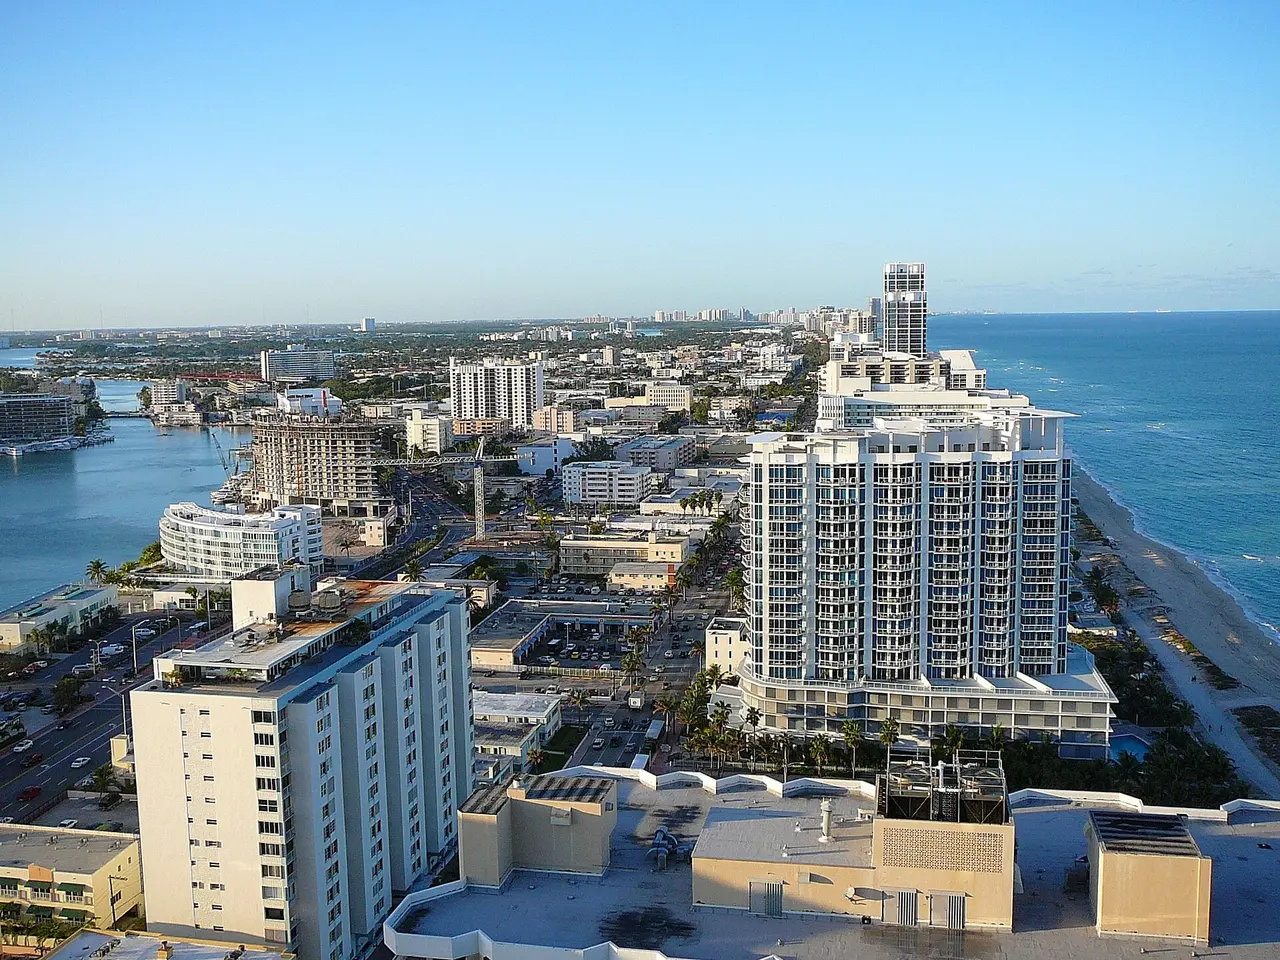
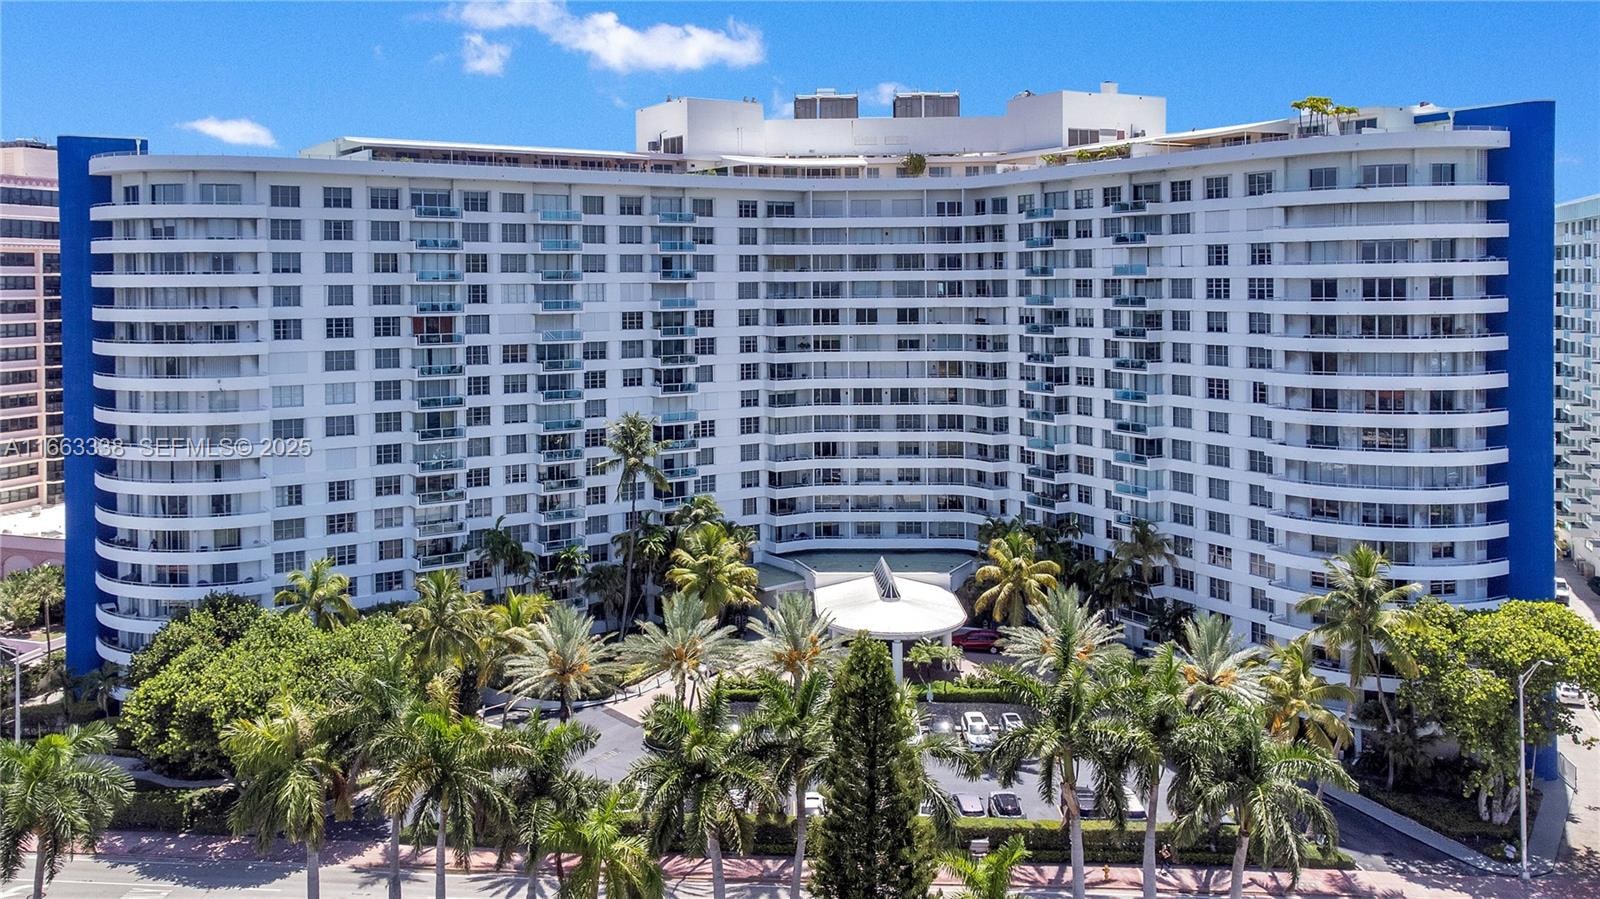
Miami Beach from Dade Boulevard to 87th Terrace: the Faena District and Millionaire's Row towers along Collins, then North Beach's MiMo blocks and the Normandy Isles on the bay.
545 of 854 are priced $450K+ and browsable on own.miami; the stats above cover every condo for sale.
Set your price and bedrooms — we email you the moment a match lists. Just your email, no password.
15 Art Week exhibitions within or near Mid-Beach & North Beach.
Ranks #5 of 12 in Miami
 Flanigan's IndexLive now
1 Flanigan's locations within 5 miles of Mid-Beach & North Beach.
Ranks #5 of 12 in Miami
4 Publix stores within 3 miles of Mid-Beach & North Beach.
Ranks #9 of 12 in Miami
Distances are straight-line, not walking or driving.
3-month rolling median of closed sales per square foot; bars are closings per month.
Each pin shows active listings in that building.
Five standard market signals in one reading: 0 is a strong buyer's market, 100 a strong seller's.
Room to negotiate. Offers below asking are normal, and most listings will still be there next week.
Price to the sold comps, not to other asking prices, and be ready to negotiate.
Miami overall: 25 · Buyer's market — In line with Miami overall
How long today's listings would take to sell at the past year's sales pace. In Miami condos, under 6 months favors sellers and over 9 favors buyers.
Median sale price as a share of the original asking price, sales in the last 6 months. Above 97% favors sellers; below 95% means buyers are negotiating.
Median days from listing to sale for homes sold in the last 6 months. Faster sales favor sellers.
Share of homes for sale now asking less than their original price. More cuts mean sellers are chasing buyers.
Closings in the last 90 days against the same 90 days a year earlier, plus the change in sale-to-list. Rising sales tilt the market toward sellers.
Resale condos from the MLS (pre-construction towers excluded), all prices. As of Oct 31, 2026 · How the index works
Based in part on information from the Southeast Florida Multiple Listing Service (SEFMLS) or from MIAMI Association of REALTORS® for the period July 19, 2025 through October 31, 2026.
There are 854 condos for sale in Mid-Beach & North Beach across 98 tracked buildings. Asking prices start at $95,000; the median asking price is $550,000 ($557/sqft).
719 condos closed in Mid-Beach & North Beach in the last 12 months at a median of $464/sqft, down 2.7% from a year earlier. Latest data month: 2026-10.
Across condos currently for sale in Mid-Beach & North Beach, the median HOA fee is $1,174 per month.
Own Miami tracks 98 condo buildings in Mid-Beach & North Beach (83 on the water); see the rankings for how they score.


 -28%
 -24%
 -23%
 -23%
 -21%
 -20%
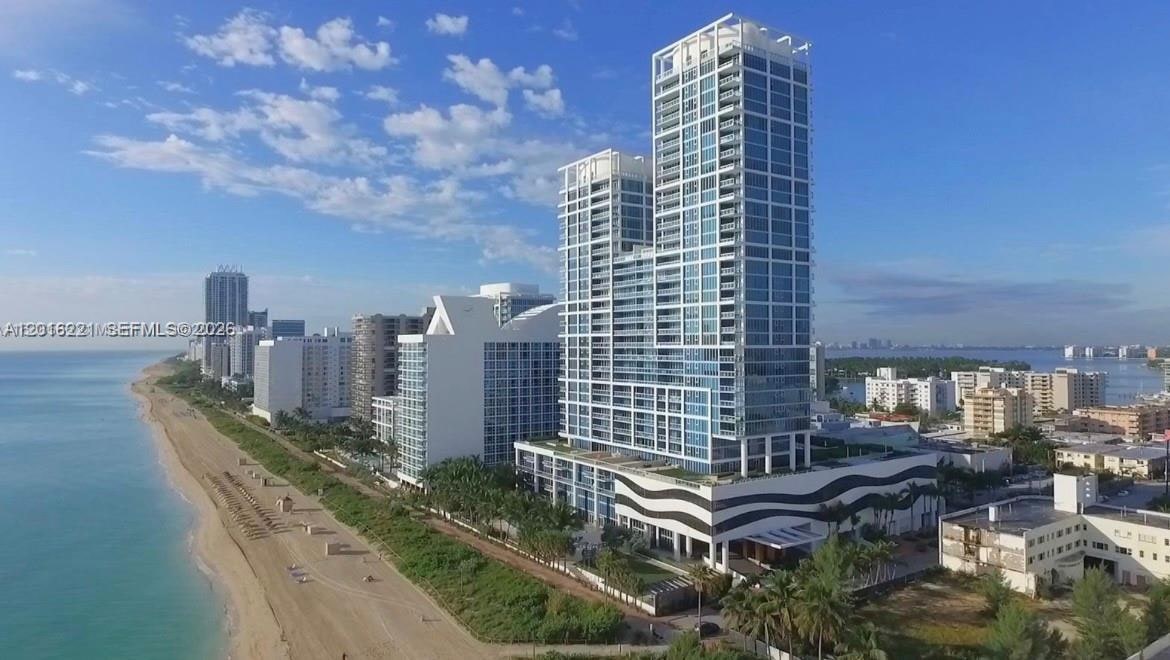
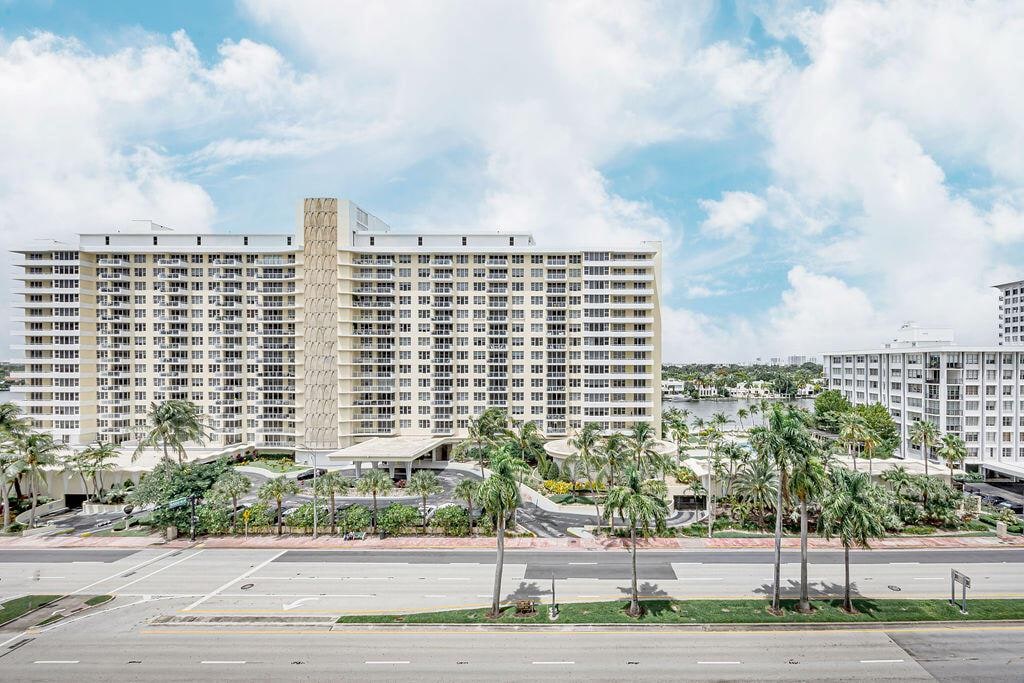
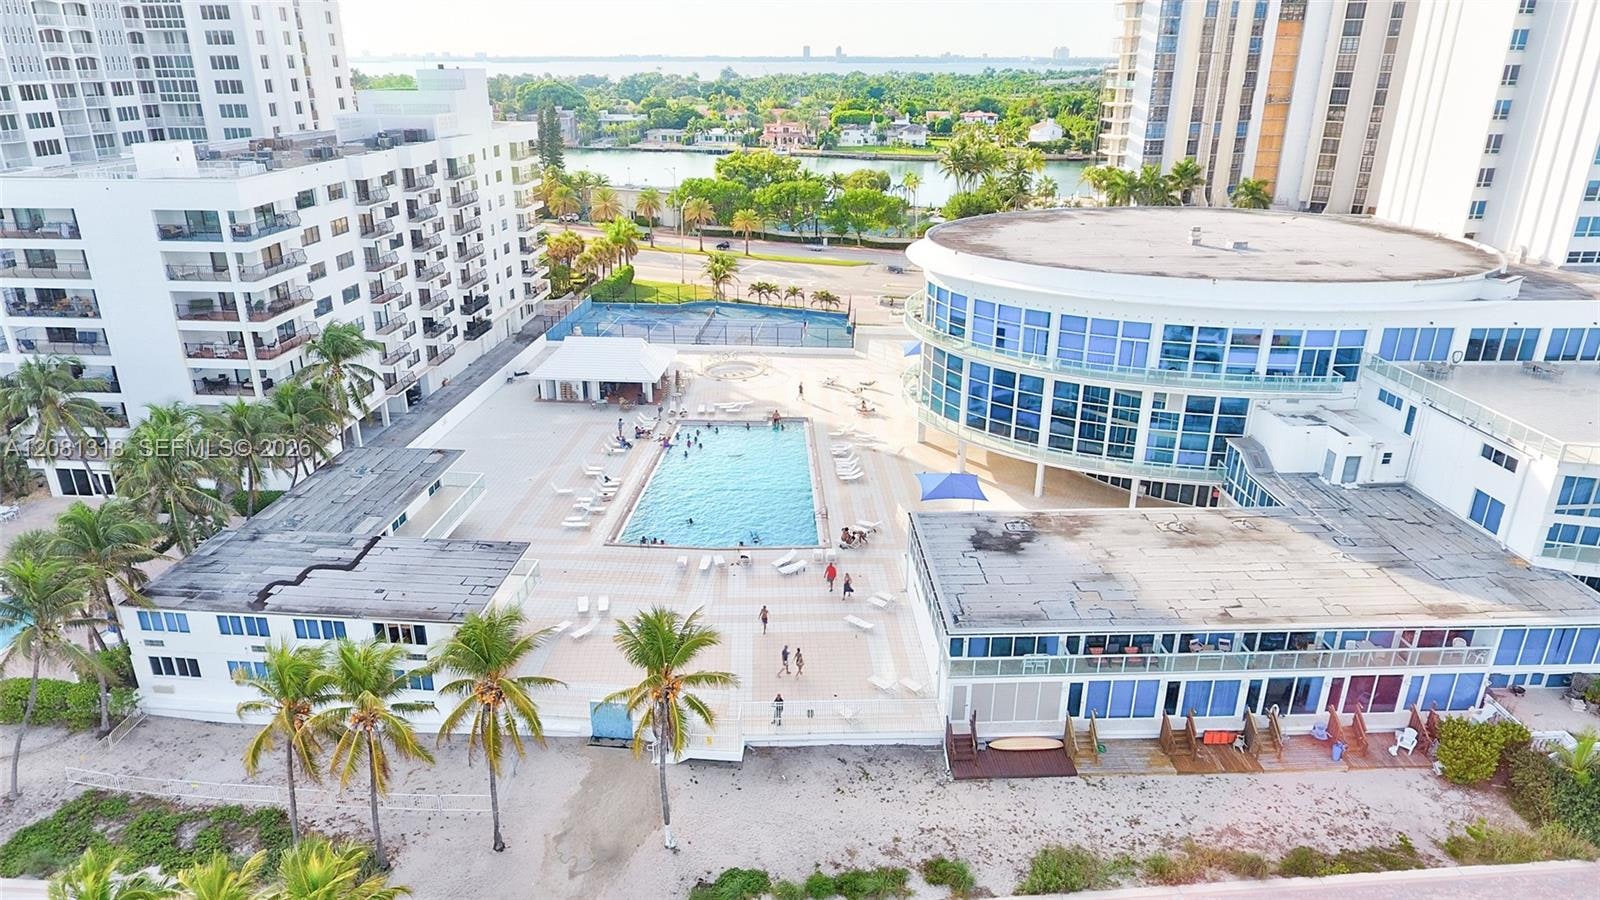
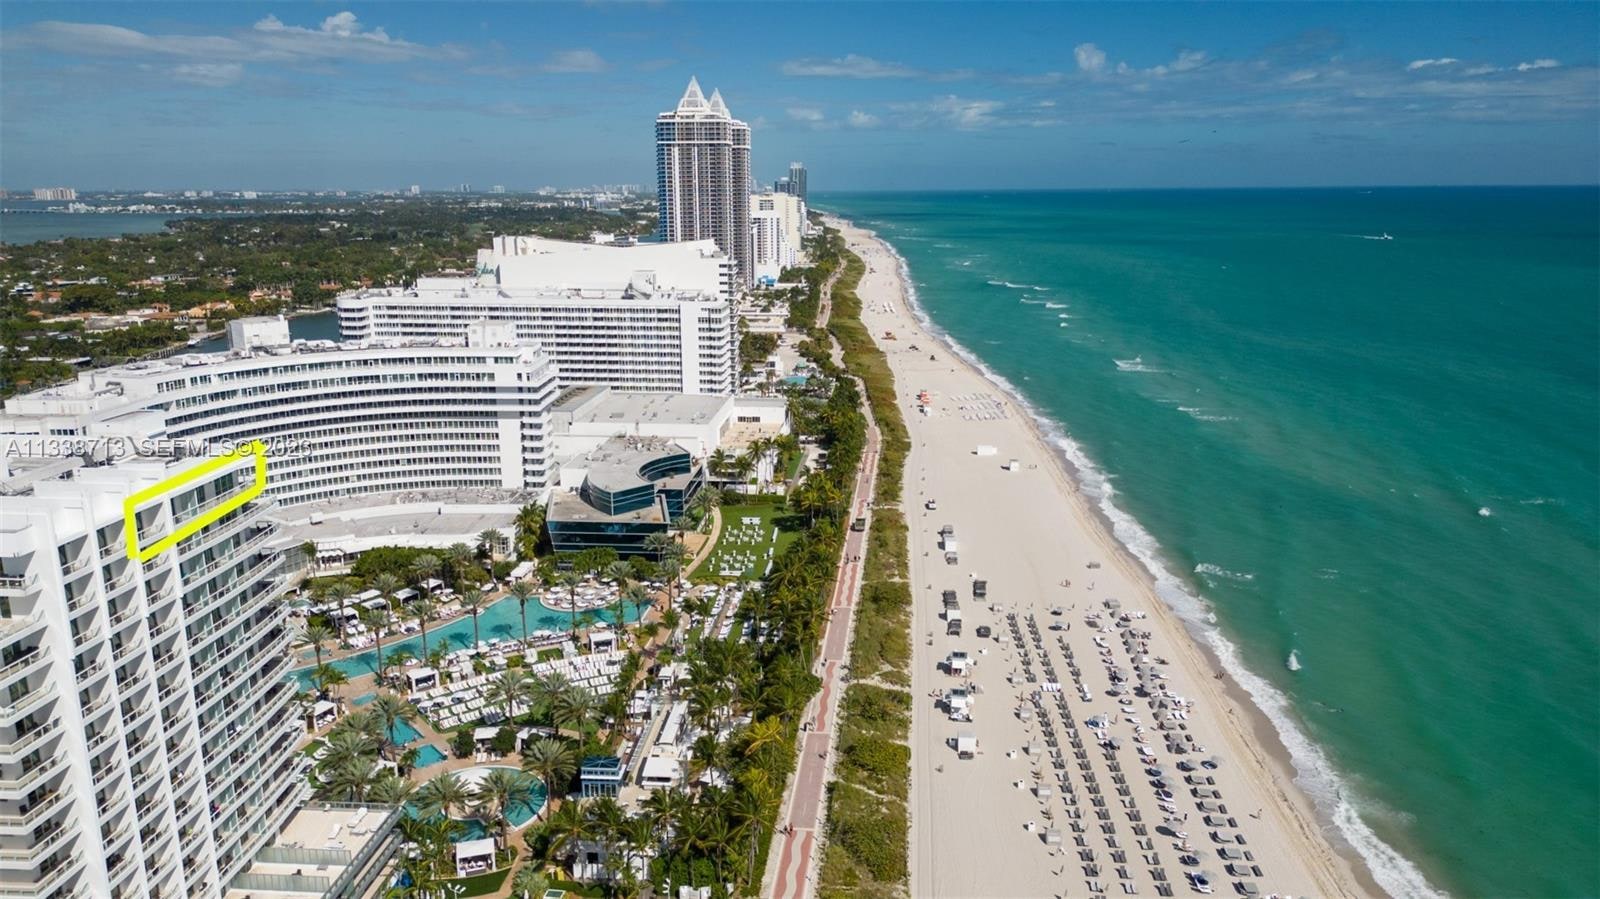
Mid-Beach begins where South Beach's Art Deco grid ends at Dade Boulevard and runs north along Collins Avenue past the Fontainebleau and Eden Roc to 63rd Street. This is Millionaire's Row: a line of oceanfront towers from the 1960s to the 2010s, the Faena District's hotel and residences, and the boardwalk that runs the full length of the beach behind them. Across Indian Creek, La Gorce and Allison Island are single-family enclaves, so the condo stock here is almost entirely on the ocean side of Collins.
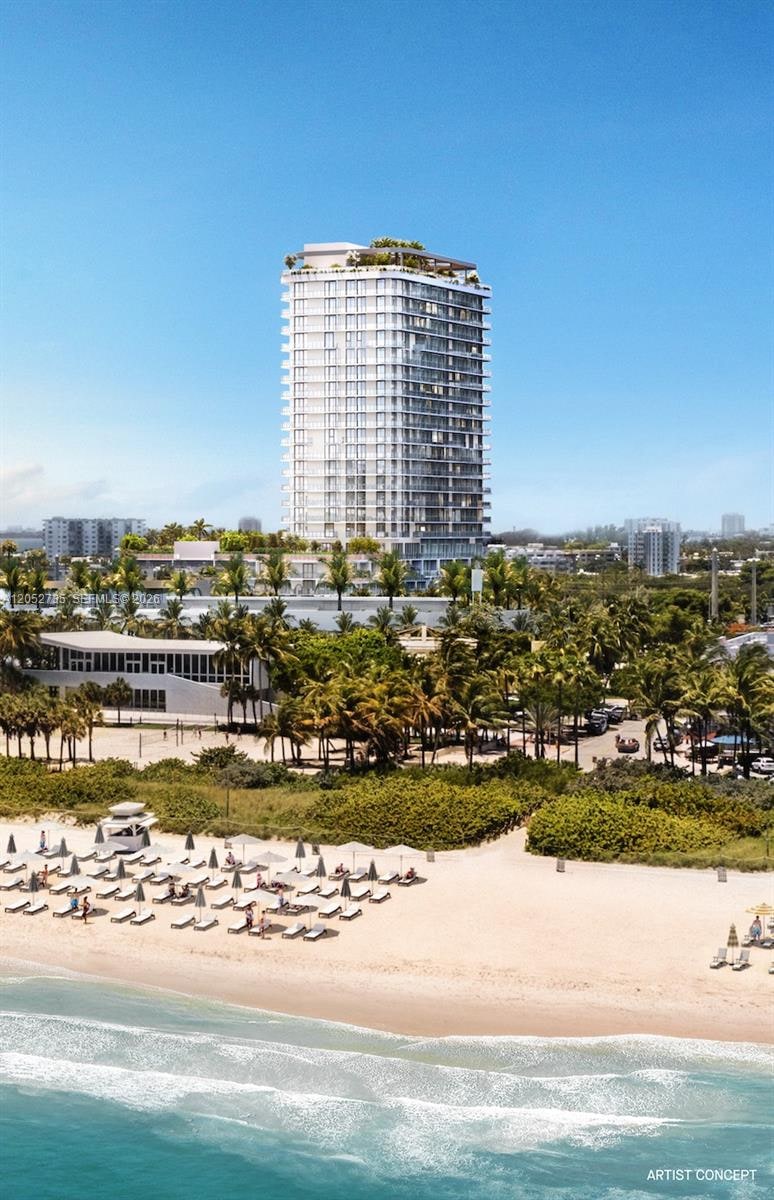
North Beach, from 63rd Street to the Surfside line, is a different scale. The 1950s MiMo buildings of the North Shore and Altos del Mar blocks are low-rise and walkable, North Shore Open Space Park keeps 70th to 87th Street open to the beach, and the 71st Street corridor crosses to the Normandy Isles — two bayfront islands of garden buildings, a golf course and a small town center. A handful of new towers, including Carillon and the North Beach oceanfront projects now in sales, sit among them.
On the building pages the split is visible in the numbers: Mid-Beach oceanfront towers trade at Miami Beach's highest prices per square foot outside South of Fifth, while North Beach and the Normandy Isles offer the widest range of entry prices on the island. Many buildings here are past forty years old, so milestone inspection results, reserve funding and special-assessment history are tracked building by building.
| Unit | Beds / baths / sf | Sold | $/sf | Date |
|---|---|---|---|---|
| 7900 Harbor Island Dr #825 | 2 / 2 / 1,552 | $689,000 | Sep 25, 2026 | |
| 4779 Collins Ave #1805 Blue Diamond | 2 / 2 / 1,380 | $1,475,000 | Sep 14, 2026 | |
| 6423 Collins Ave #1702 Mar Del Plata | 1 / 1.5 / 1,412 | $700,000 | Sep 24, 2026 | |
| 2899 Collins Ave #1624 Triton Tower | 1 / 1.5 / 797 | $475,000 | Oct 22, 2026 | |
| 6801 Indian Creek Dr #207 | 2 / 2 / 1,160 | $460,000 | Oct 2, 2026 | |
| 4401 Collins Ave #1401 Fontainebleau Trésor | 0 / 1 / 516 | $855,000 | Oct 22, 2026 | |
| 6899 Collins Ave #1905 Carillon North Tower | 2 / 2 / 1,290 | $2,000,000 | Sep 22, 2026 | |
| 900 Bay Dr #702/704 King Cole | 4 / 3 / 3,189 | $2,218,849 | Aug 31, 2026 |
We track every listing here, every day. Get the next one before it hits the portals — and a straight answer from someone who knows the building.