Aventura condo market report — Nov 2026
Live inventory as of today; sales figures from closed MLS transactions.
Where the market stands
1,106 condos are for sale today against a pace of 62 sales a month — 17.8 months of supply, a buyer's market. 42% of active listings have cut their price, by a median 6.3%. Sellers achieved a median 89.4% of their original asking price; 5% closed at or above ask.
Is Aventura a buyer's or a seller's market?
Five standard market signals in one reading: 0 is a strong buyer's market, 100 a strong seller's.
You have real leverage: ask for price cuts and credits, and take your time — plenty of comparable units are waiting.
Price at or slightly below the recent sold comps from day one — overpriced listings here sit for months and end up cut.
Miami overall: 25 · Buyer's market — 6 points more buyer-friendly than Miami overall
What's behind the reading
- Months of supply16.7 monthsFavors buyers1106 listings · 793 sales in 12 months · weight 35%
How long today's listings would take to sell at the past year's sales pace. In Miami condos, under 6 months favors sellers and over 9 favors buyers.
- Sale-to-list price89.4%Favors buyers403 sales · weight 25%
Median sale price as a share of the original asking price, sales in the last 6 months. Above 97% favors sellers; below 95% means buyers are negotiating.
- Days on market95 daysFavors buyers407 sales · weight 15%
Median days from listing to sale for homes sold in the last 6 months. Faster sales favor sellers.
- Listings with a price cut42%Favors buyers1106 listings · weight 15%
Share of homes for sale now asking less than their original price. More cuts mean sellers are chasing buyers.
- Sales momentum+22% vs last yearFavors sellers358 sales · weight 10% · sale-to-list +1.7 pts
Closings in the last 90 days against the same 90 days a year earlier, plus the change in sale-to-list. Rising sales tilt the market toward sellers.
Resale condos from the MLS (pre-construction towers excluded), all prices. As of Nov 1, 2026 · How the index works
Based in part on information from the Southeast Florida Multiple Listing Service (SEFMLS) or from MIAMI Association of REALTORS® for the period July 20, 2025 through November 1, 2026.
The last 12 months vs the year before
745 condos closed in Aventura between Dec 1, 2025 and Nov 1, 2026, +6% vs the prior 12 months, at a median $430K (-2%) and $326 per sqft (-2%). Sold units took a median 98 days to go under contract.
Sold $/sqft and closings, 24 months
| Month | New listings | Closed | Median sold | Median sold $/sf | Median DOM |
|---|---|---|---|---|---|
| Nov 2026 | — | — | — | — | — |
| Oct 2026 | 177 | 59 | $415K | $325/sqft | 110 |
| Sep 2026 | 155 | 59 | $435K | $326/sqft | 71 |
| Aug 2026 | 171 | 58 | $488K | $329/sqft | 81 |
| Jul 2026 | 141 | 77 | $373K | $298/sqft | 97 |
| Jun 2026 | 140 | 82 | $400K | $307/sqft | 100 |
| May 2026 | 116 | 80 | $420K | $331/sqft | 94 |
| Apr 2026 | 112 | 83 | $450K | $330/sqft | 94 |
| Mar 2026 | 128 | 73 | $480K | $351/sqft | 105 |
| Feb 2026 | 125 | 64 | $405K | $320/sqft | 102 |
| Jan 2026 | 134 | 48 | $488K | $353/sqft | 96 |
| Dec 2025 | 67 | 62 | $430K | $318/sqft | 115 |
Inventory and sales by price band
Whole-market counts; months of supply = actives ÷ monthly sales pace.
By bedrooms
| Size | For sale | Median asking | Asking $/sqft | Sold (12 mo) | Median sold | Sold $/sqft | Days |
|---|---|---|---|---|---|---|---|
| Studio | 5 | $299K | $448/sqft | 5 | $254K | $386/sqft | 34 |
| 1 bed | 197 | $230K | $284/sqft | 99 | $180K | $209/sqft | 87 |
| 2 bed | 609 | $430K | $352/sqft | 430 | $400K | $312/sqft | 93 |
| 3 bed | 246 | $849K | $468/sqft | 180 | $780K | $422/sqft | 113 |
| 4+ bed | 49 | $2.3M | $746/sqft | 31 | $2.5M | $660/sqft | 108 |
New vs resale: by building era
| Era | Buildings | For sale | Asking $/sqft | Sold (12 mo) | Sold $/sqft |
|---|---|---|---|---|---|
| Built 2020+ | 2 | 4 | $350/sqft | 3 | $342/sqft |
| 2010s | 5 | 41 | $776/sqft | 26 | $728/sqft |
| 2000s | 25 | 268 | $454/sqft | 145 | $429/sqft |
| 1990s | 20 | 210 | $404/sqft | 175 | $359/sqft |
| Before 1990 | 36 | 345 | $321/sqft | 249 | $294/sqft |
The floor premium
Median sold $/sqft by floor, last 12 months.
Waterfront vs the rest
Units flagged waterfront sold at a median $348 per sqft (531 sales) against $282 for the rest (214 sales) — +24%.
Most sales, last 12 months
| Building | Sold (12 mo) | Median price | Sold $/sqft |
|---|---|---|---|
| Waterview | 23 | $379K | $333/sqft |
| Mystic Pointe Tower 500 | 21 | $450K | $341/sqft |
| Williams Island 1000 | 20 | $513K | $300/sqft |
| Hamptons West | 19 | $490K | $318/sqft |
| Commodore Plaza | 19 | $190K | $185/sqft |
| Turnberry Isle South Tower | 18 | $647K | $326/sqft |
Fastest to contract
Buildings with at least 5 sales, by median days on market.
| Building | Days | Sold (12 mo) | Sold $/sqft |
|---|---|---|---|
| Williams Island 4000 | 15 | 9 | $338/sqft |
| Admirals Port East | 35 | 10 | $191/sqft |
| Atlantic II at The Point | 39 | 12 | $445/sqft |
| Williams Island 7000 | 43 | 10 | $595/sqft |
| Village By The Bay | 44 | 8 | $401/sqft |
Most inventory
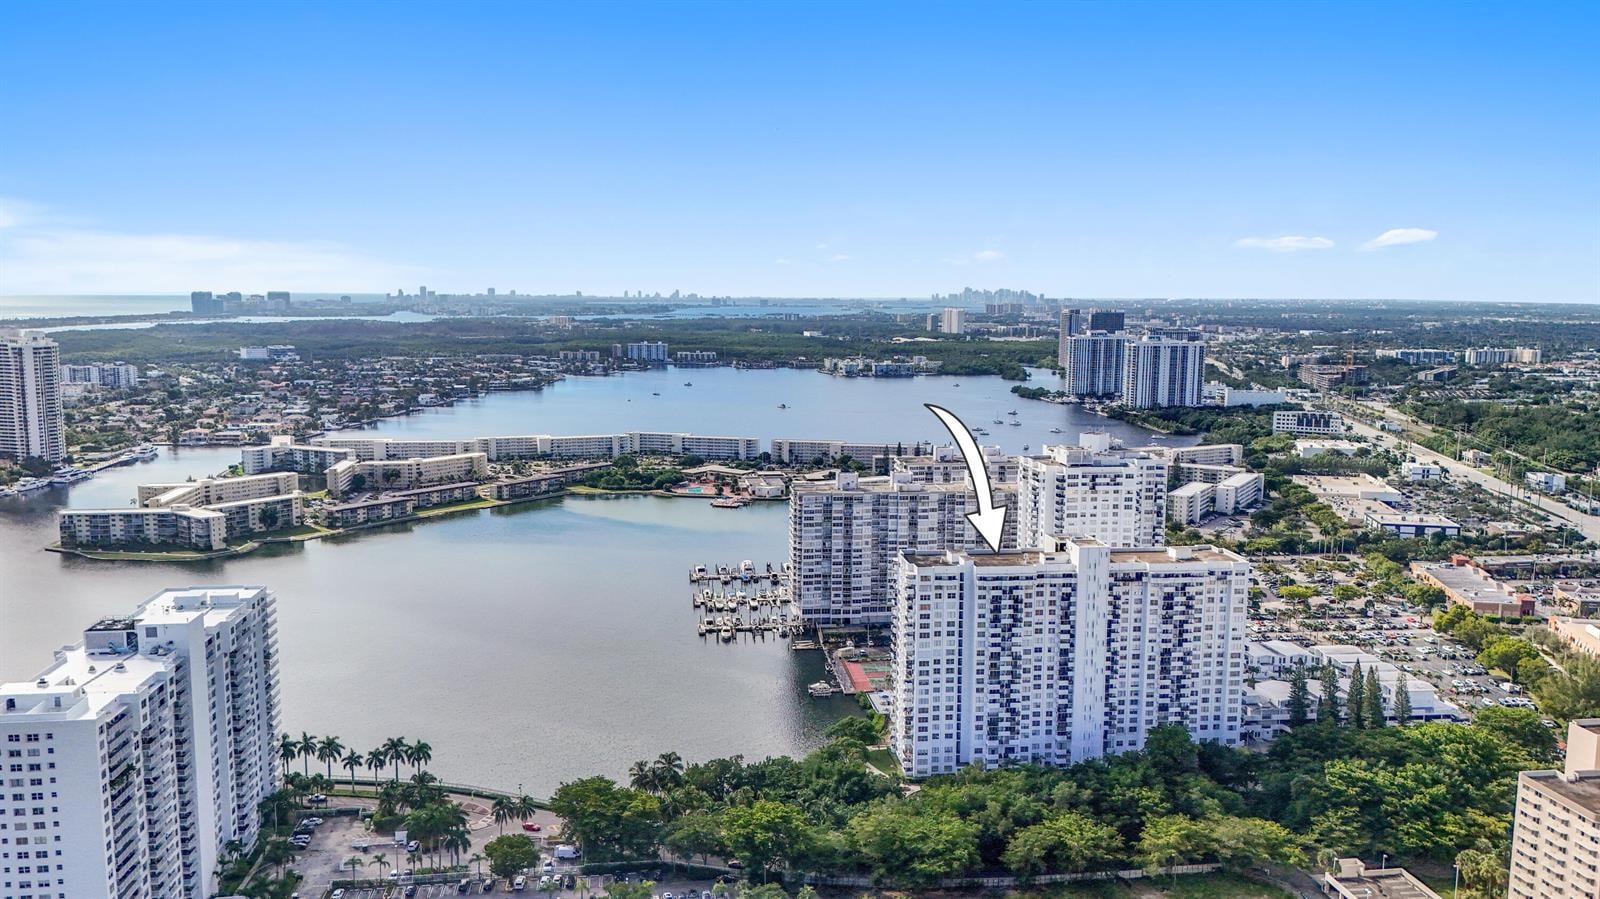
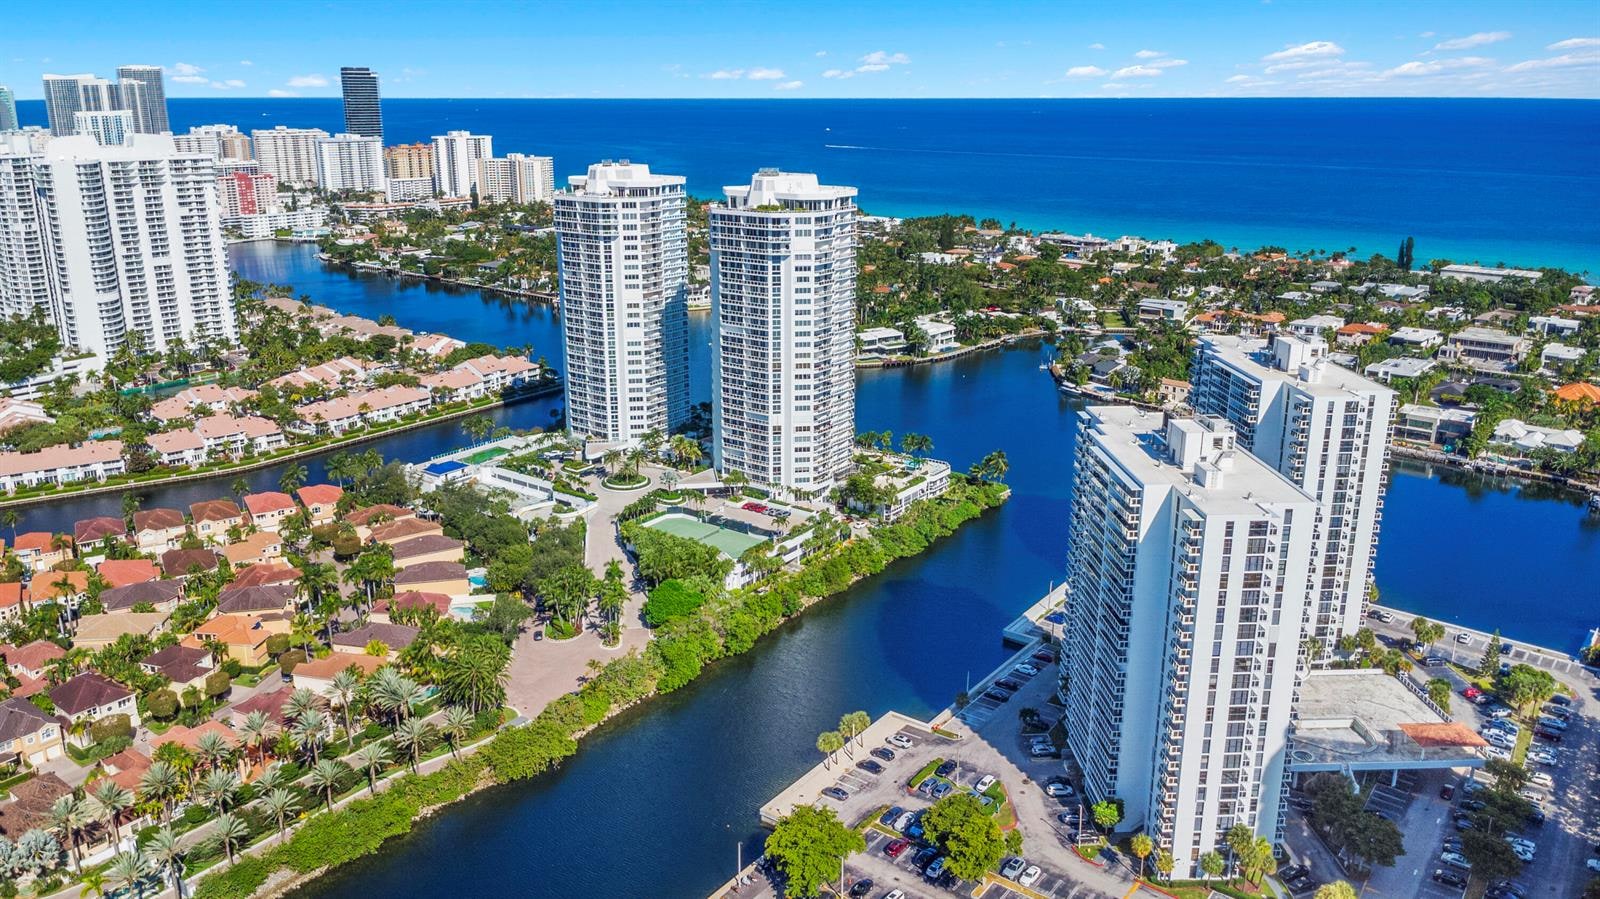
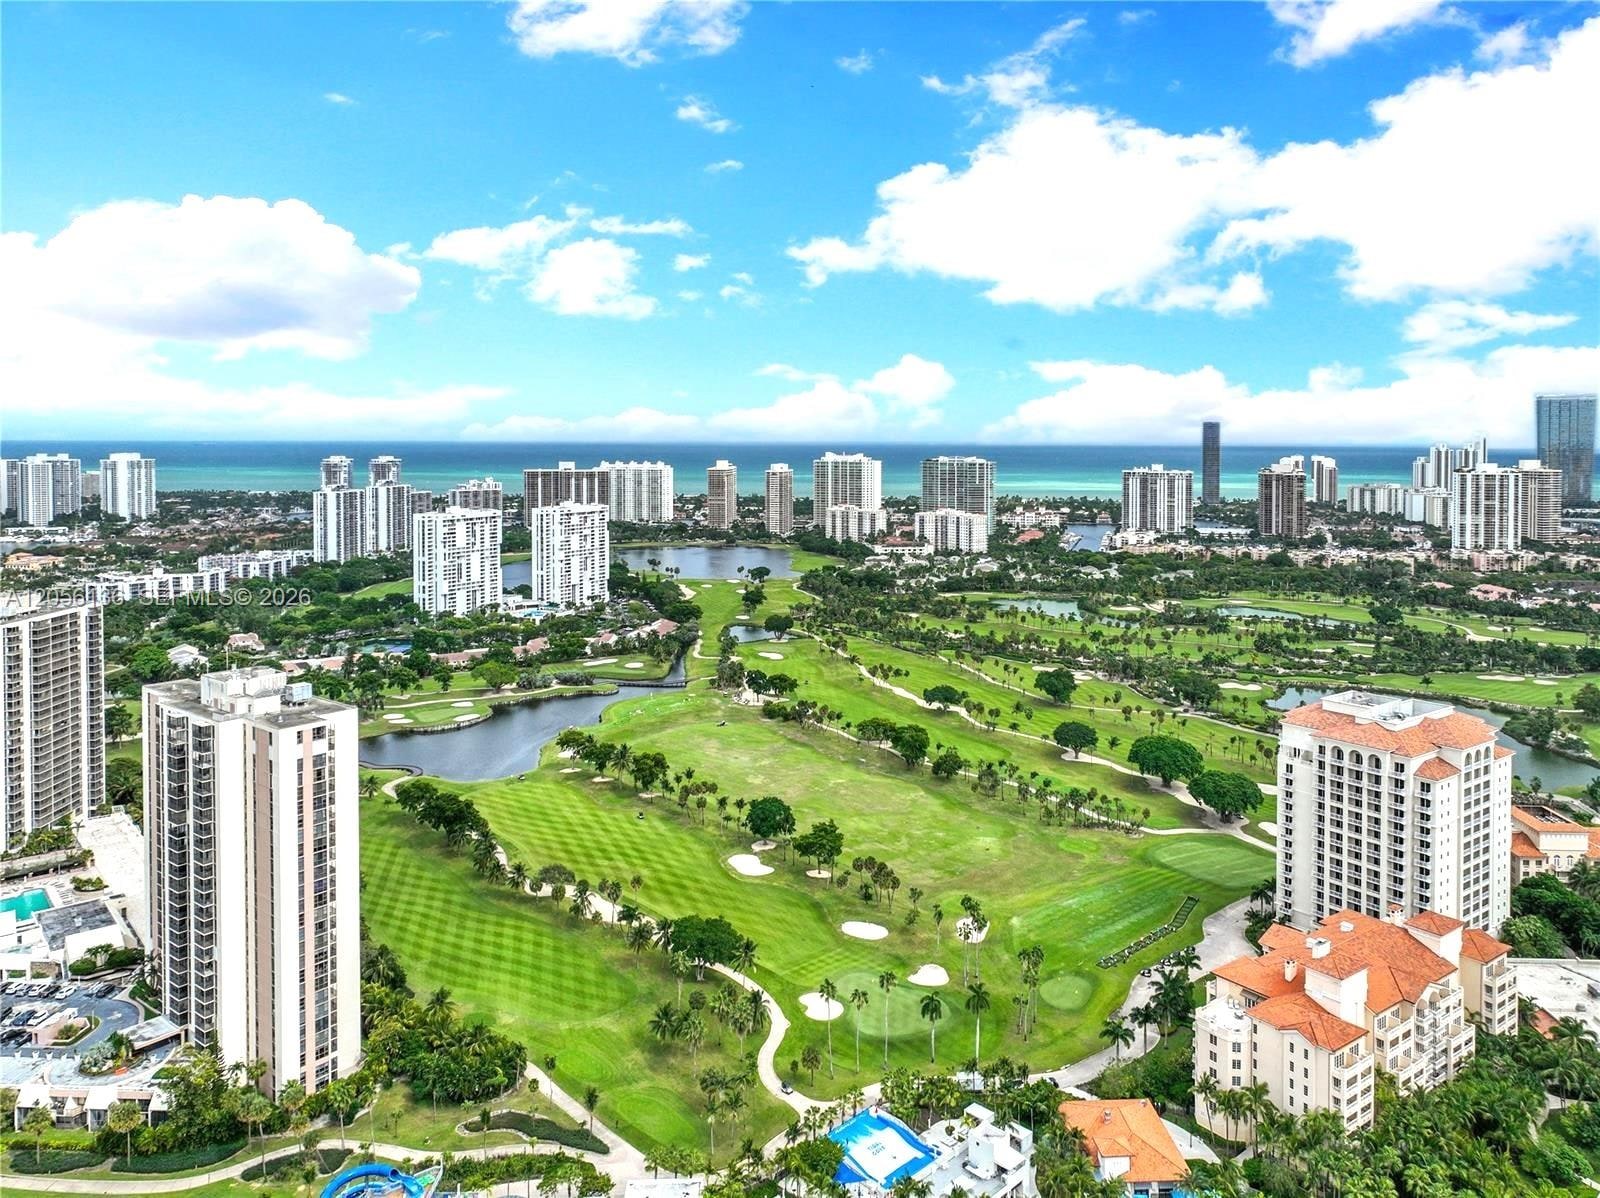
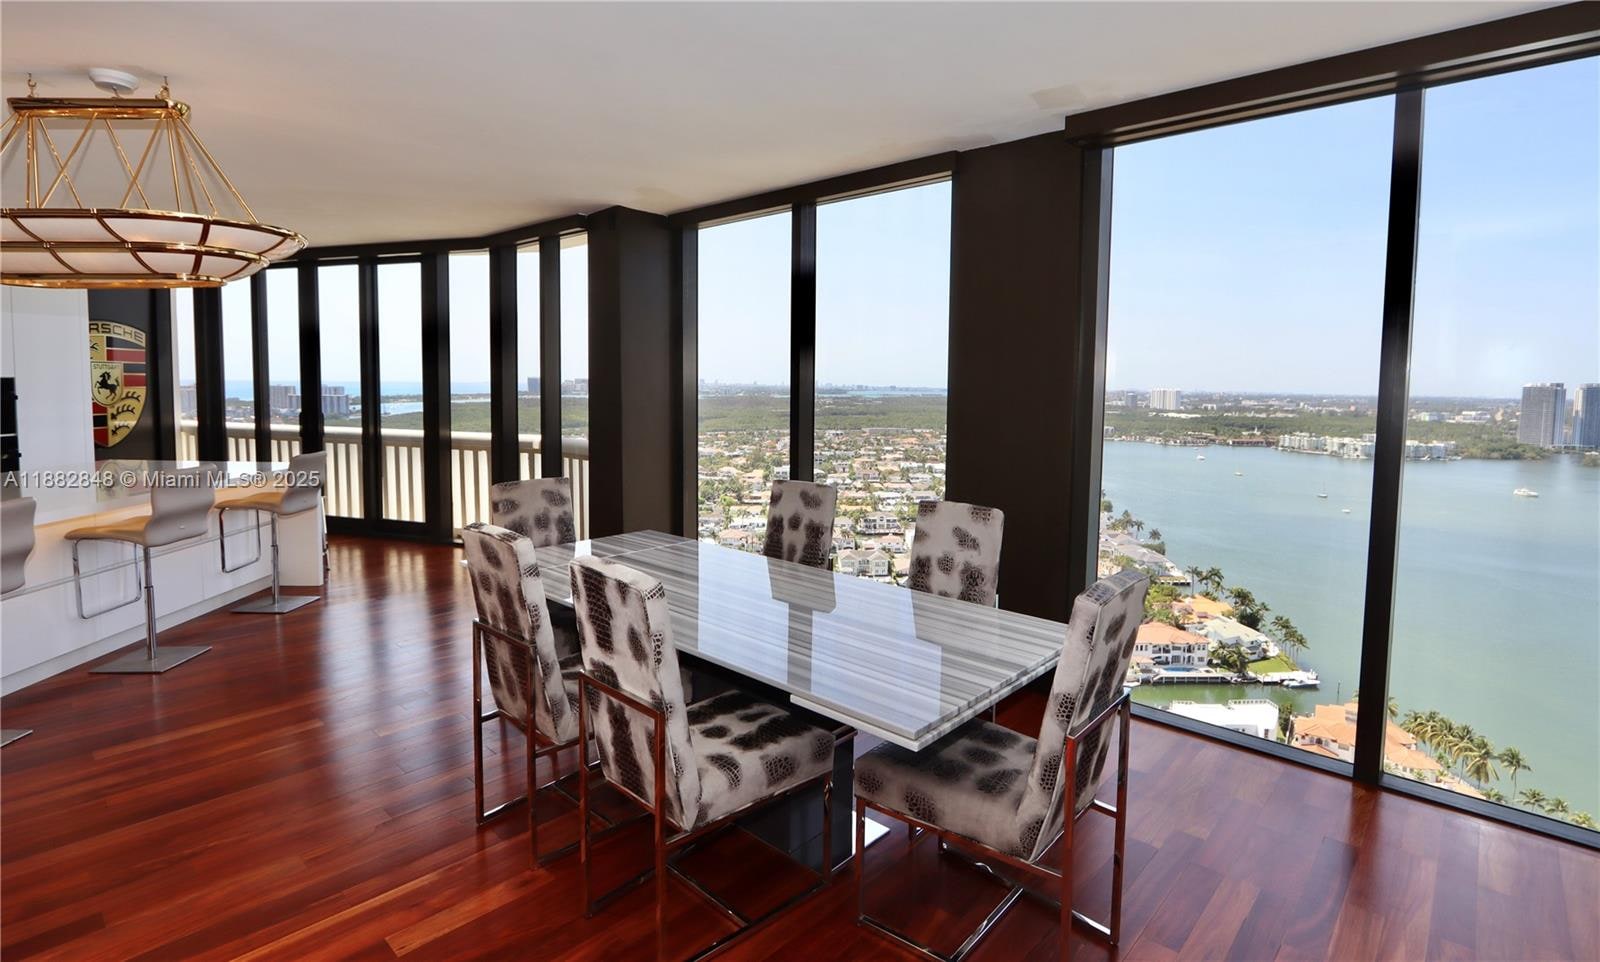
Highest asking $/sqft
Building quality and risk
83 Aventura buildings carry an own.miami Score (average 63). 33 have their public records checked clean — no liens, lawsuits or regulatory complaints. 14 have a special assessment in force, 1 an open or overdue recertification, and 6 active material litigation.
Condo Index tiers
New construction pipeline
1 developments are selling or under construction in Aventura (22 planned units). Pre-construction asking prices run $710 per sqft against $368 for resale — a +93% premium.
Biggest price cuts on the market
Active listings with the largest reductions from their original asking price.
 -31%
 -28%
 -26%
 -25%
 -25%
Highest closings, last 90 days
| Unit | Beds / baths / sf | Sold | $/sf | Date |
|---|---|---|---|---|
| 3000 Island Blvd #PH-4 Williams Island 3000 | 3 / 5.5 / 4,232 | $3,850,000 | Oct 26, 2026 | |
| 20155 NE 38th Ct #1802 Porto Vita North Tower | 3 / 5.5 / 3,374 | $3,300,000 | Sep 15, 2026 | |
| 6000 Island Blvd #707 Bella Mare | 3 / 3.5 / 2,840 | $3,100,000 | Sep 18, 2026 | |
| 7000 Island Boulevard #Ph-06 Williams Island 7000 | 4 / 4 / 4,260 | $2,810,000 | Sep 8, 2026 | |
| 21200 Point Pl #1901 Atlantic I at The Point | 5 / 4.5 / 4,169 | $2,750,000 | Aug 7, 2026 |
Sales figures are closed MLS transactions at every price (pre-construction towers are excluded from resale medians); inventory is live at the time of viewing. Building Scores, Condo Index tiers and health records are own.miami datasets. A case or record is a claim, not a finding.
Based in part on information from the Southeast Florida Multiple Listing Service (SEFMLS) or from MIAMI Association of REALTORS® for the period September 1, 2023 through November 1, 2026.
Writing about Aventura? The citable monthly figures, CSV downloads and charts are in the Data room.
Looking for a specific tower? Browse every Aventura building.