Miami Condo Data · Fisher Island
A monthly, citable snapshot of the Miami condominium market: sales volume, prices, and building-inspection pressure across the neighborhoods own.miami tracks.
February 2026, ready to quote
The month in sentences you can paste straight into a story: each copy carries its citation.
- 1
The top Fisher Island condo sale of February 2026 was $15M at Palazzo della Luna (Fisher Island).
The numbers: Palazzo della Luna · February 2026 · top sale: $15M
Source: own.miami Data Room, February 2026, https://own.miami/data/2026-02?n=fisher-islandNeed a custom cut, a chart sized for your outlet or a comment? [email protected]
Free to publish under CC BY 4.0, credit “own.miami” and link the page.
Source: Own Miami, https://own.miami/data
Based in part on information from the Southeast Florida Multiple Listing Service (SEFMLS) or from MIAMI Association of REALTORS® for the period November 1, 2023 through November 1, 2026.
Market movers
Standout activity this month across the condos we track, free to quote.
Verified-records datasets
Numbers nobody else publishes: read from the Miami-Dade Clerk, the court docket, Florida DBPR, HUD and the VA, building by building, then rolled up. Aggregates only, never a loan, lender, buyer, party or unit.
Live snapshot as of Nov 1, 2026, not tied to the report month.
How Miami condo buyers pay
From mortgages and deeds recorded over the last 12 months in 15 tracked condo buildings.
Government-backed loans: 0 of 15 buildings are on HUD’s FHA-approved condo list today and 0 on the VA’s; 0 FHA or VA loans were recorded in 12 months.
0 of 15 buildings are financeable at ordinary terms (Financeability Index strong or good). Building-by-building financeability →
The bank-financed share is a floor: a loan we could not pair to its deed is not counted, so “no bank mortgage” includes cash, private and seller financing. Down payments are read from loans a regulated lender wrote and paired to the sale price.
Checked against the public record
14 buildings were searched in the Miami-Dade Clerk’s official records and Florida DBPR within the last 90 days.
- Special assessment in force (per the building’s own listings)fewer than 3
- Listings state no special assessmentfewer than 3
- City of Miami 40-year recertification 2+ years overdue or plan lapsedfewer than 3
- City of Miami 40-year recertification completedfewer than 3
- Open or disciplined DBPR complaintfewer than 3
Liens, lis pendens and association collections count toward a building’s verdict but are never published by kind or by building. Every reading is reviewed before it counts.
What condo associations are in court over
Civil cases involving the associations of 13 buildings, from the Miami-Dade court docket, classified by type and reviewed.
- Construction-defect, structural or developer suitsfewer than 3
- Only routine liability (slip-and-fall, employment)fewer than 3
Florida DBPR, the condominium regulator: 1 of 14 associations drew a complaint in 36 months: 1 complaints, 1 still open, 0 closed with discipline.
Counts only. Cases still awaiting review are left out, and types seen in fewer than 3 buildings are not shown. DBPR investigations are confidential and never counted.
Cite as: own.miami Data Room, Nov 1, 2026 (CC BY 4.0).
Year to date
Through Feb 2026Median sold price per sq ft, monthly
Source: Own Miami, https://own.miami/data
Based in part on information from the Southeast Florida Multiple Listing Service (SEFMLS) or from MIAMI Association of REALTORS® for the period November 1, 2023 through November 1, 2026.
own.miami Condo Index
Our proprietary index prices every condo building per square foot against the market: 100 = the median Miami building ($716/sqft), 200 = twice that. Median building in this view: 370.
| Building | Neighborhood | Index | Momentum | $/sq ft |
|---|---|---|---|---|
| Palazzo della Luna | Fisher Island | 492 | +77 | $3,989/sqft |
| Palazzo del Sol | Fisher Island | 487 | -13 | $3,689/sqft |
| Oceanside at Fisher Island | Fisher Island | 423 | 0 | $2,971/sqft |
| Bayview at Fisher Island 4900 | Fisher Island | 390 | 0 | $2,900/sqft |
| Bayview at Fisher Island 5100 | Fisher Island | 373 | 0 | $2,689/sqft |
| Palazzo del Mare | Fisher Island | 368 | 0 | $2,954/sqft |
| Bayview at Fisher Island 5300 | Fisher Island | 334 | 0 | $1,824/sqft |
| Seaside Village | Fisher Island | 326 | -94 | $2,147/sqft |
Building health
Special-assessment outlook across tracked towers, as shown on each building page, building age under Florida SB-4D, active-listing disclosures and verified public records (a City of Miami recertification on file moves a tower out of Elevated). An estimate, not an inspection finding. The median is the Health axis of the own.miami Building Score.
Buildings facing structural milestone inspections
4 of 14 tracked condo towers hit a Florida SB-4D inspection milestone within 2 years: 0 facing a first 25-year inspection and 4 due for a recurring 10-year review.
A milestone is a mandated inspection deadline set by a building’s age, not a finding that a building is unsafe. Estimate from public building age under Florida SB-4D (coastal Miami: first milestone at 25 years, then every 10). Not an inspection record, verify any specific building with its association.
This data room is machine-readable end to end: structured data (schema.org Dataset), an open JSON API, and a stable URL. Point any AI assistant at it.
Try: “ChatGPT, draft me an article about Edgewater’s condo index using https://own.miami/data”
When you cite it, please refer to us as Own.Miami and link https://own.miami.
Open JSON API ↗Share & embed
Everything here is free to cite and republish with attribution to Own Miami. Grab a chart, a social card, the full PDF, or the raw JSON.
Every chart in 16:9 and 1:1, the story cards, the social preview image and the press-release PDF for 2026-02, one file.
Publish-ready PNGs with title, month and source line. Free to use with attribution.

Embed the live chart: paste this into any webpage or CMS:
<iframe src="https://own.miami/embed/data/chart?n=fisher-island" width="640" height="380" style="border:1px solid #e6e1d8;border-radius:14px;max-width:100%" title="Miami Condo Data" loading="lazy"></iframe>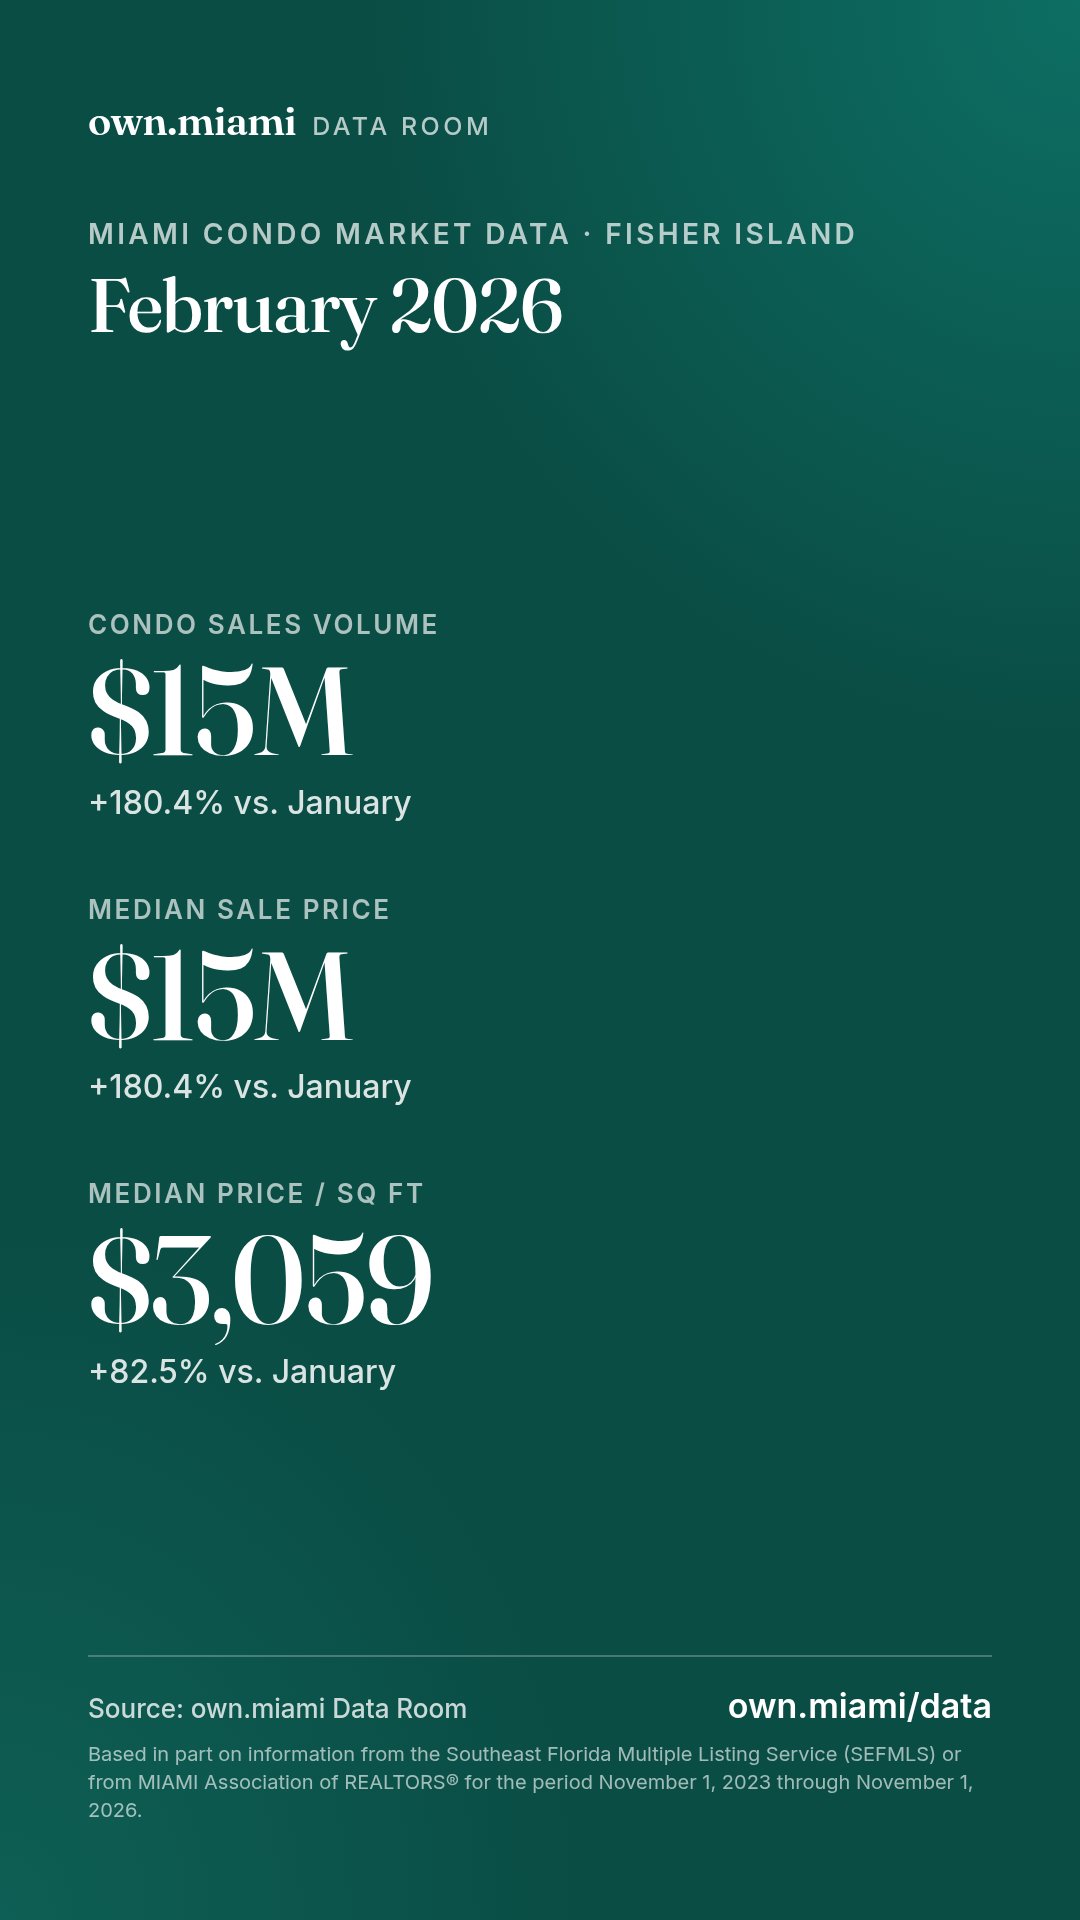
On a phone, Share opens your share sheet (Instagram, TikTok, X…); on desktop it downloads the image.
Figures are compiled from Miami MLS closed-sale records for condominiums at every price across the 1 neighborhoods own.miami tracks: the whole condo market, not only the listings on own.miami, which start at $450K. Each sale is counted once (per MLS listing) in the calendar month it closed. Sales volume is the sum of closed prices; medians are per closed sale. Month-over-month and year-over-year changes are shown only when both months cover the same neighborhoods, where a neighborhood’s full history starts later, the comparison is withheld rather than letting the change in coverage pass for a market move. Active inventory is live: condos listed for sale today at every price, excluding towers not yet delivered; months of supply divides it by the average monthly resale closings over the 12 months ending with the report month. Building health follows each building page: age under Florida SB-4D (first milestone at 25 years on the coast, then every 10) plus verified public records such as a City of Miami recertification on file.
This data is free to cite and republish with attribution to Own.Miami (own.miami).
Press & data requests: [email protected]
Help shape the data. Want a metric, a neighborhood, or a cut of the data we’re not showing yet? Tell us what would be most useful for your reporting and we’ll build it into the next report. Suggest data →
Updated Feb 2026 · Source: Own Miami, https://own.miami/data
Based in part on information from the Southeast Florida Multiple Listing Service (SEFMLS) or from MIAMI Association of REALTORS® for the period November 1, 2023 through November 1, 2026.